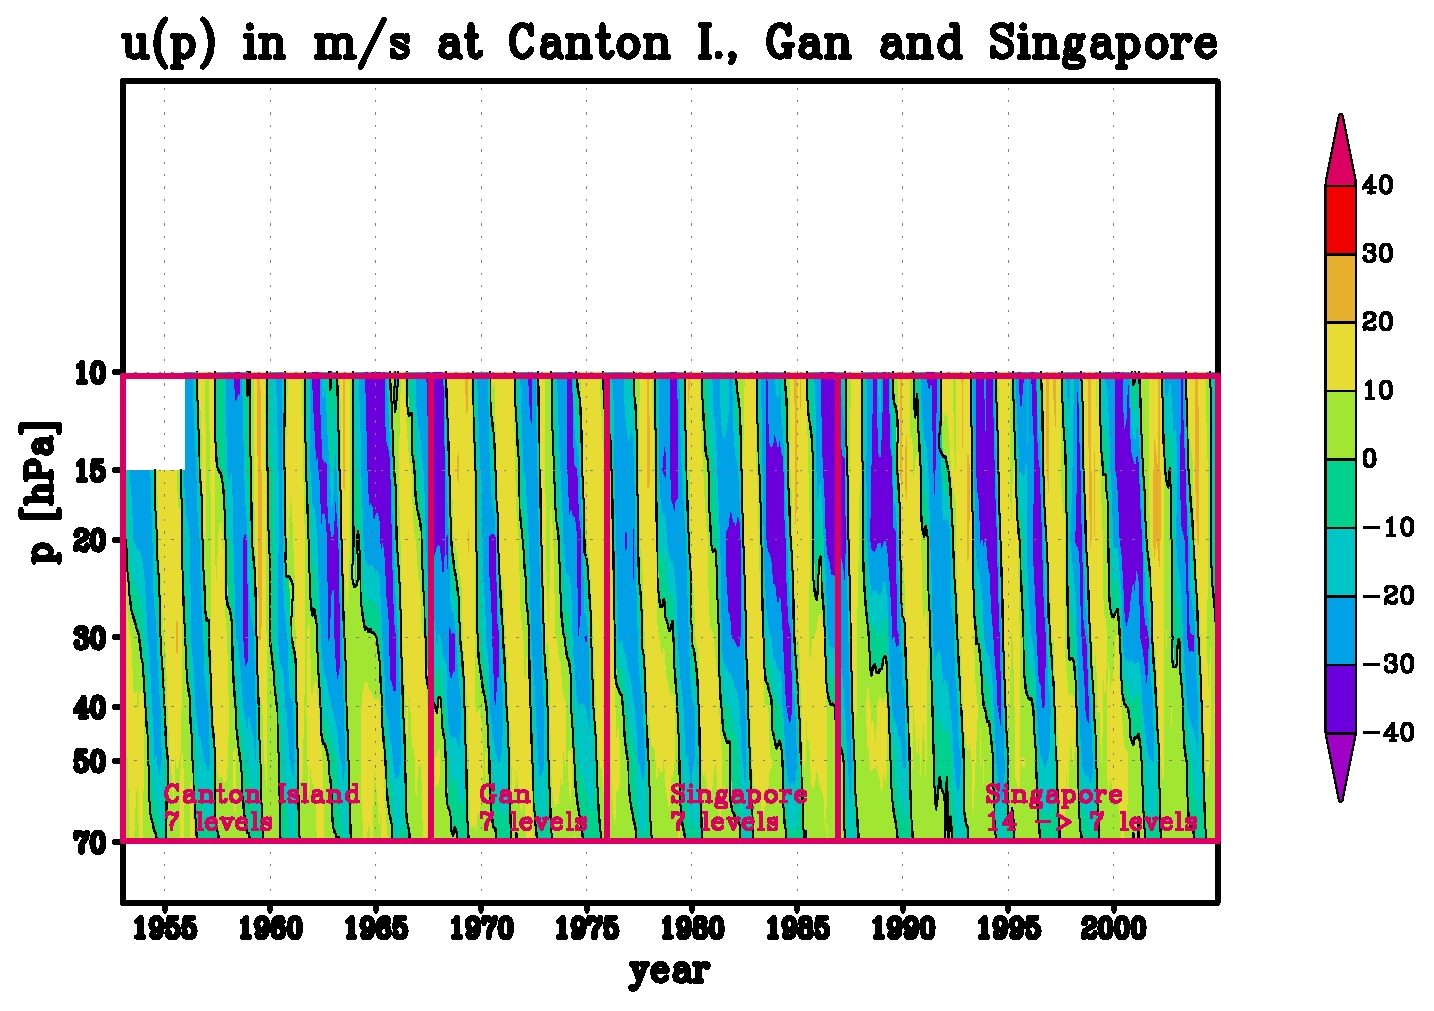
Figure 1. QBO in observed monthly mean zonal wind in m/s on 7 levels from 1953 to 2004.
This document and the attached data sets are compiled for activities in SCOUT-O3 and CCMVal [--> CCMVal].
Within both projects it is planned to compare climate chemistry
simulations for the past few decades, which should include "slow" modes
of variability following the observations. Slow refers to time scales
longer than a year, as typically generated by El Nino/La Nina, QBO,
solar sunspot cycle, volcanic eruptions, trends in emissions etc. Most
of these forcings are external to an atmosphere-only model, with the
exception of the QBO. The QBO is generated by internal processes of the
atmosphere, but is not simulated in most current climate chemistry
models (CCMs). Consequently QBO effects on circulation and chemistry
are often neglected. However, assimilation of the zonal wind in the QBO
domain can add the QBO to the system, thus providing for example its
effects on transport and chemistry. For this reason it is planned to
include the QBO in climate chemistry experiments for SCOUT-O3 and
CCMVal by means of assimilation, so that the QBO follows a prescribed
external QBO. The following sections describe the construction of a
dataset that has been used for this purpose. This is followed by a short
discussion of the pros and cons of the assimilation of the QBO.
The QBO in zonal wind (see Baldwin et al. (2001) for a recent review) is directly observed in operational wind measurements by rawinsondes at equatorial meteorological observatories. Ideally these measurements are made within 2 degree latitude from the equator. Barabara Naujokat of the stratospheric research group at the Free University Berlin has collected and processed radio sonde measurements from 1953 onward from Canton Island, Gan(Maledives) and Singapore as compiled in Table 1 (Naujokat, 1986; Labitzke et al., 2002). These profiles are commonly used to describe the QBO.
| Station | Coordinates | Months |
| Canton Island (91700) | 02 46 S / 171 43 W | Jan.1953-Aug.1967 |
| Gan/Maledives (43599) | 00 41 S / 73 09 E | Sept.1967-Dec.1975 |
| Singapore (48698) | 01 22 N / 103 55 E | Jan.1976-Dec.2004 |
Table 1. Stations, their geographic coordinates and active time periods until December 2004.
Zonal wind data of these stations have been analyzed and gridded on
7 standard levels from 70 to 10 hPa until December 1986. Later profiles
have been analyzed for characteristic points and interpolated to a
higher resolved 14 levels grid from 90 to 10 hPa (Table 2). Observations
are usually available twice daily at 00 and 12. Only earlier years have
less frequent observations, sometimes less than 10 per month.
Additional values for 100 hPa, as obtained from CLIMAT TEMP data, are
added in 1997 and later. Data files, as distributed by Barbara
Naujokat, are compiled in Table 3. Flags indicate if data are missing
or if the number of observations in a month is less than 10.
| Levels |
hPa |
| 7 |
70, 50, 40, 30, 20, 15, 10 |
| 14 |
90, 80, 70, 60, 50, 45, 40, 35, 30, 25, 20, 15, 12, 10 |
| 19 |
90, 80, 70, 60, 50, 45, 40, 35, 30, 25, 20, 15, 12, 10, 8, 6, 5, 4, 3 |
Table 2. Pressure levels used for the low and high resolution data
sets with 7 or 14 levels, respectively, and the extended dataset with
19 levels. Standard level are in bold, levels above 10 hPa in italics.
| Station | Months | Levels |
Files (text format) |
| Canton Island | Jan.1953-Aug.1967 | 7 | Canton_u_195301_196708 |
| Gan/Maledives | Sept.1967-Dec.1975 | 7 | Gan_u_196709_197512 |
| Singapore | Jan.1976-Dec.1986 | 7 | Singapore_u_197601_198612 |
| Singapore | Jan.1987-Dec.2004 | 14 (15) |
Singapore_u_198701_200412 |
Table 3. Data files for Canton Island, Gan/Maledives and Singapore
from January 1953 to December 2004. Until 1986 the data are gridded on
7 standard levels.
The QBO shows a high degree of zonal symmetry (see for example in
Naujokat, 1986). This allows to merge the equatorial zonal wind profiles
of the individual stations into one dataset covering a longer time
period. Here, the time series of Canton Island, Gan/Maledives and
Singapore are merged at either the low resolution of 7 levels (Figure
1), thus subsampling the profiles after 1986, or at the higher
resolution of 14 levels (Figure 2), for which the low resolution
profiles are interpolated using 3rd order polynomials (Table 4).
| Levels |
Files |
| 7 level QBO 1953-2004 |
u_profile_lowres.txt (text file) u_profile_lowres (GrADS data file) u_profile_lowres.ctl (GrADS control file) u_profile_lowres.tar |
| 14 level QBO 1953-2004 | u_profile_highres.txt (text file) u_profile_highres (GrADS data file) u_profile_highres.ctl (GrADS control file) u_profile_highres.tar |
Table 4. Data files for merged datasets 1953-2004 on 7 leves or 14 levels.
Figure 1. QBO in observed monthly mean zonal wind in m/s on 7 levels from 1953 to 2004.
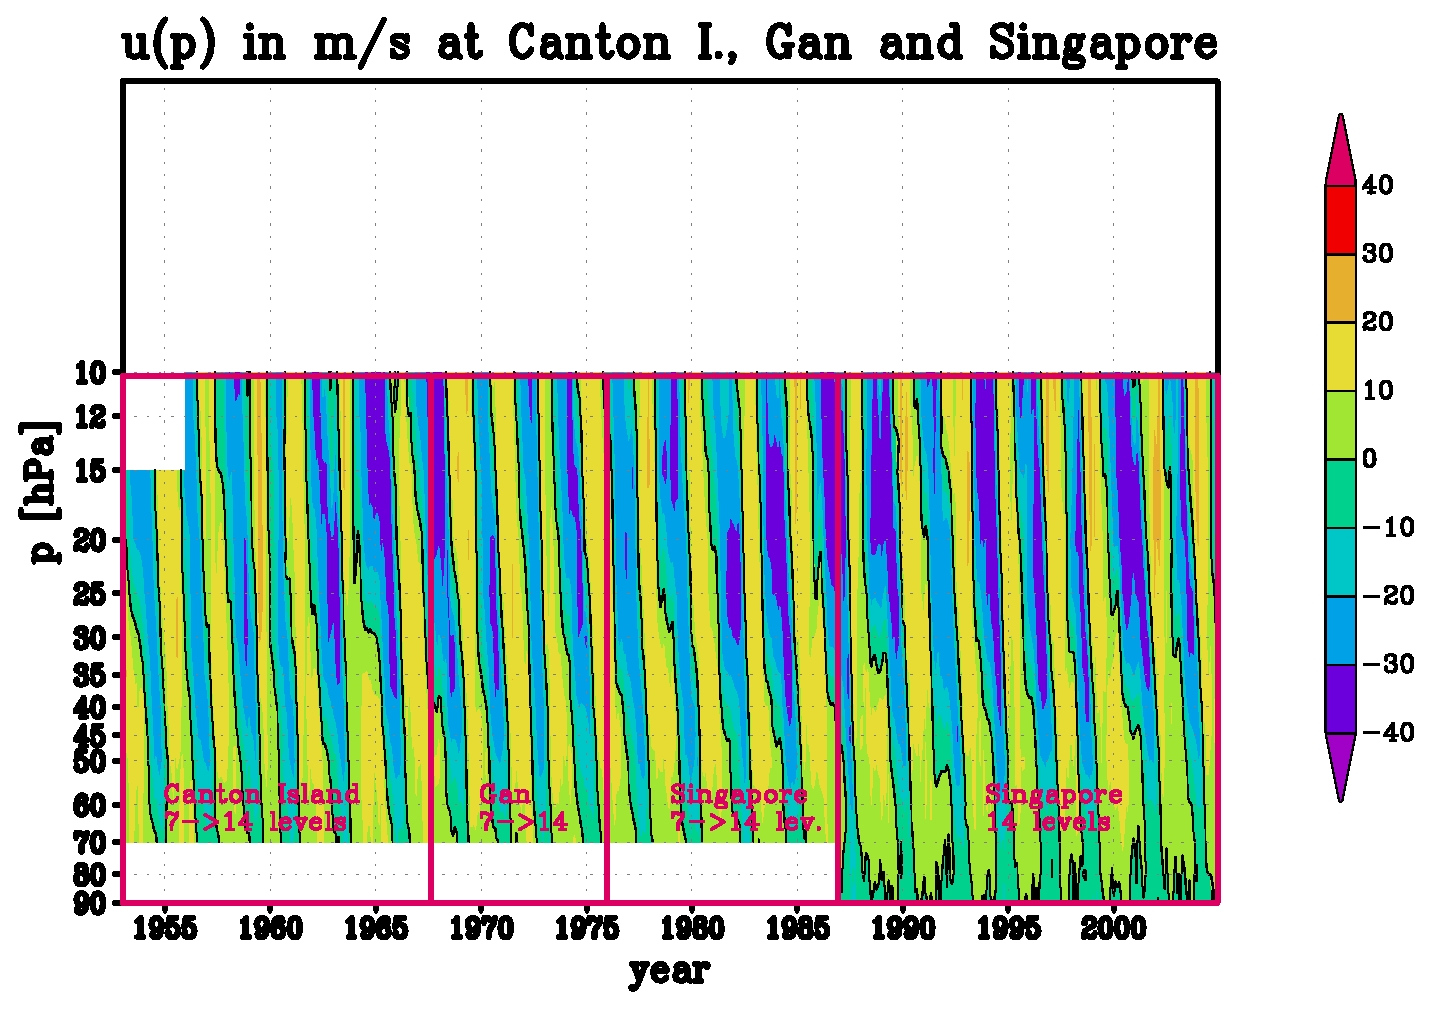
Figure 2. QBO in observed monthly mean zonal wind in m/s on 14 levels from 1953 to 2004.
| Levels |
Files |
| 19 levels |
u_profile_extres.txt (text file) u_profile_extres (GrADS data file (ieee, little endian, sequential)) u_profile_extres.ctl (GrADS control file) u_profile_extres.tar |
Table 5. Data file for merged datasets 1953-2004 on 7 leves or 14 levels.
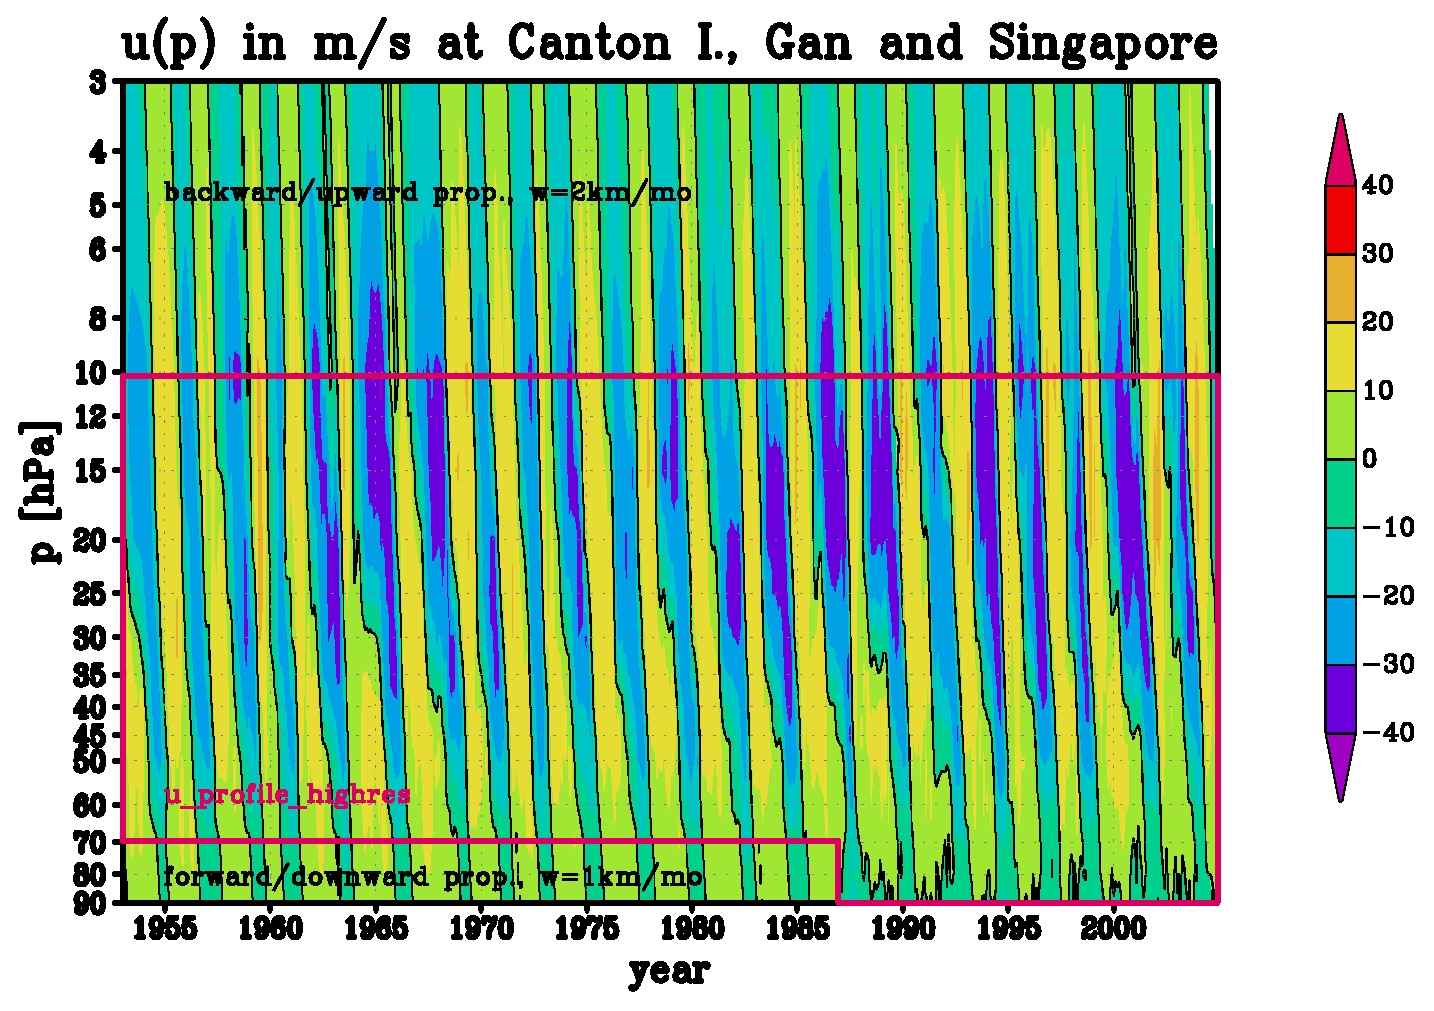
Figure 3. Observed QBO in zonal wind in m/s wirthin red box extended
vertically by the propagation method upward to 3 hPa and downward to 90
hPa, for 1953 to 2004.
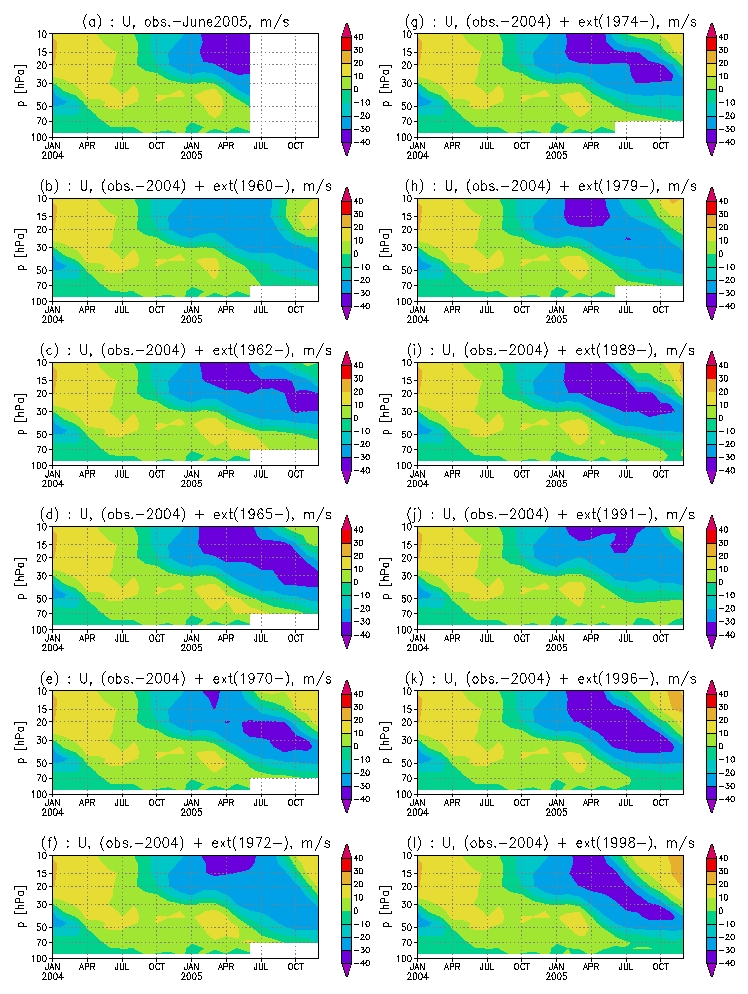
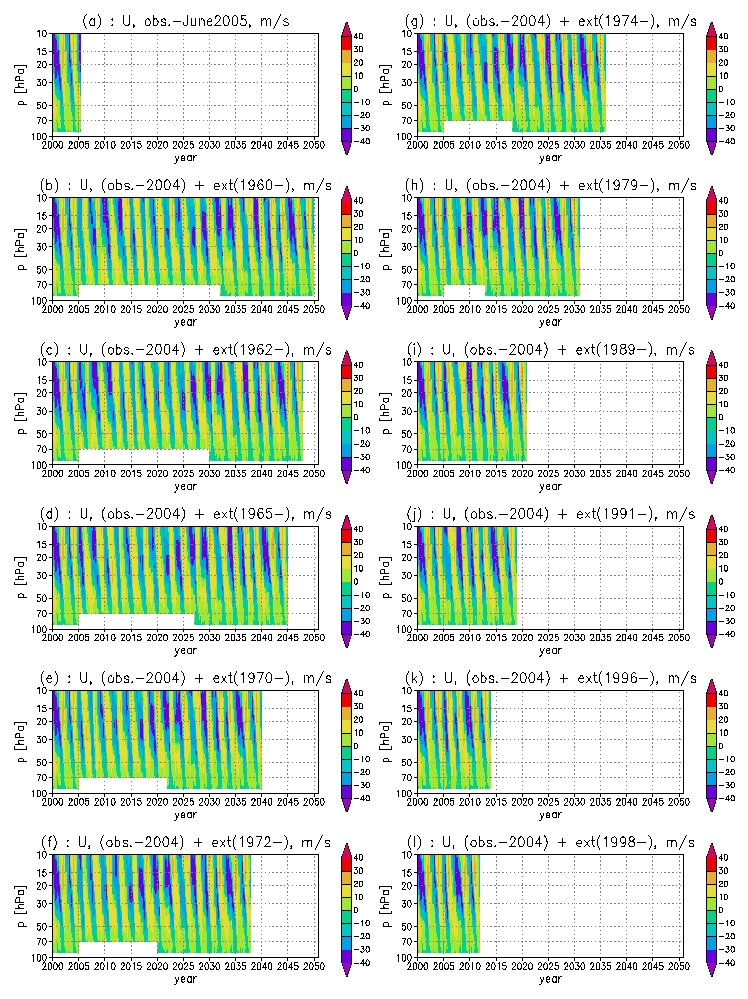
For some purposes it is useful to have arbitrarily long QBO time
series based on observed QBO wind profiles, which are available for
about 50 years. This calls for a method to expand the observed time
series in a reasonable way. Here you find a description of a pragmatic
method that consists in the repetition of previous periods of the
observed QBO. The following recipe has been used for the purpose of
extending the observed QBO time series after January 2005:
| Levels |
Files |
| 14 level QBO 1953-2004 | u_profile_highres_ext_1960-2004.txt u_profile_highres_ext_1962-2004.txt u_profile_highres_ext_1965-2004.txt u_profile_highres_ext_1970-2004.txt u_profile_highres_ext_1972-2004.txt u_profile_highres_ext_1974-2004.txt u_profile_highres_ext_1979-2004.txt u_profile_highres_ext_1989-2004.txt u_profile_highres_ext_1991-2004.txt u_profile_highres_ext_1996-2004.txt u_profile_highres_ext_1998-2004.txt u_profile_highres_ext_2003-2004.txt u_profile_highres_ext_2004.tar |
Baldwin M. P. et al. , The quasi-biennial oscillation. Rev. Geophys., 39, 179-229, 2001.
Giorgetta, M. A., and L. Bengtsson, Potential role of the quasi-biennial oscillation in the stratosphere-troposphere exchange as found in water vapor in general circulation model experiments, J. Geophys. Res., 104, 6003-6019, 1999.
Giorgetta, M. A., E. Manzini, and E. Roeckner, Forcing of the quasi-biennial oscillation from a broad spectrum
of atmospheric waves, Geophys. Res. Lett., 29, 10.1029/2002GL014756, 2002.
Labitzke et al. 2002: The Berlin stratospheric data series. Meteorological Institute, Free University of Berlin, CD-ROM.
Naujokat, B., 1986: An update of the observed quasi-biennial oscillation of the stratospheric winds over the tropics. J. Atmos. Sci., 43, 1873-1877.