Field campaign [-]
![]() Aircraft instrumentation
Aircraft instrumentation
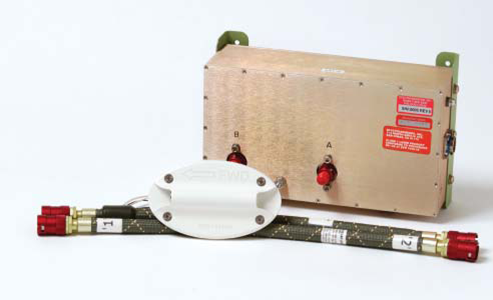
![]() Instruments
Instruments
![]() Maps
Maps
![]() Forecast products
Forecast products
CONCERTContrail and Cirrus ExperimentHomepage for the CONCERT Falcon campaigns in 2008 and 2011 |
Click on the images below to enlarge.
Detection limit: few to some ten ppt


This optical spectrometer measures the size and shape of particles passing through its collimated laser beam, from 25µm to 1600 µm with a resolution of 25µm. It is capable of concentrations up to 100cm-3 and airspeeds up to 200 ms-1. It uses a fast 64-element photodiode array to generate 2-dimensional images of the particles. Included in this instrument package are temperature, pressure and relative humidity sensors.


The FSSPs measure the forward scattering of single particles within a scattering angle of 3-15°. Using Mie-calculations, the size of a particle is related to the measured scattering cross section, which implicitly assumes spherical particles. The settings of the instruments allow determination of ice crystal size distributions in 40 size bins between 2 and 47 µm diameter (FSSP-100) and between 0.3 and 40µm (FSSP-300). Due to ambiguities in the Mie scattering curve the size distributions will be summarised in about 10 size bins.


The airborne Polar Nephelometer is designed to measure the optical and microphysical parameters of clouds containing either water droplets or ice crystals or a mixture of these particles over a size range from a few micrometers to about 800 microns diameter. The airborne version of the probe is compatible with PMS canister. The probe measures the scattering phase function of an ensemble of cloud particles which intersect a collimated laser beam near the focal point of a paraboloidal mirror. The light scattered from polar angles from ±3.49 to ±169° is reflected onto a circular array of 54 photodiodes. The signal processing electronics and computer storage can provide one measurement of the scattering phase function every 10 msec. The optical properties (extinction coefficient, asymmetry factor, backscattering coefficient, ...) are derived from the measured scattering phase functions. The particle size spectra and subsequent derived quantities such bulk parameters and size parameters are retrieved using an inversion technique. The particle phase discrimination (water droplet / ice particles) can be derived from the shape of the scattering phase function.


The CIMS (Chemical Ionization Mass Spectrometry) method equipped with an Ion Trap Mass Spectrometer (ITMS) (by Finnigan LCQ, Finnigan Company USA) is a highly sensitive instrument for atmospheric measurements of the reservoir gases HNO3 and HCl in the lower ppt range. The IT-CIMS instrument has been modified and mounted on the Falcon by MPI-K and DLR using a selective ion-molecule reaction for online detection of atmospheric trace gases at low concentrations. A standard is used for in-flight-calibration, thereby reducing uncertainties arising from wall losses and ion-hydration. HCl transported down from the stratosphere into the upper troposphere can be used as a tracer for stratospheric air masses. Gaseous HNO3 in the UT/LS is simultaneously detected.
The inlet system, using a passive flow tube combined with a pressure stabilized ionisation region, has been modified and improved to account for a faster and more sensitive detection of these acids.
Temporal resolution: 2 sec

Specifications:
- pressure controlled inlet
Measured quantities:
Time resolution:
up to 1 sec. (mass concentration mode only),Detection limits (aircraft conditions):
Species 30 sec
5 min
SO4: 0.10 µg/m3
0.03 µg/m3
NO3: 0.15 µg/m3 0.05 µg/m3
NH4: 0.24 µg/m3 0.08 µg/m3
Org: 3.0 µg/m3
0.95 µg/m3
Detection limits (standard vacuum conditions):
Species 30 sec
5 min
SO4 0.017 µg/m3 0.006 µg/m3
NO3 0.015 µg/m3 0.005
µg/m3
NH4 0.18 µg/m3 0.056
µg/m3
Org 0.83 µg/m3 0.26
µg/m3


The CPI records very high resolution (2.3 mm) digital images of cloud particles as they pass through the sample tube of the instrument. It casts an image of the particle on a solid-state CCD camera by freezing the motion of the particle using a 25 ns pulsed, high-power laser diode. Upstream lasers precisely define the depth-of-field (DOF) so that at least one particle in the image is almost always in the focus. This eliminates out-of-focus sizing errors that have plagued the conventional 2D imaging probes. The method of data processing leads to derive the particle size distribution and calculates the usual microphysical parameters: ice particle concentration, extinction coefficient, mean particle size, radar reflectivity and ice water content. The classification of the shape of the ice particles can also be derived.


Measured quantities
spectral upwelling radiances (W/(m˛ nm sr))
spectral upwelling irradiances (W/(m˛ nm))
Spectral upwelling radiances and irradiances are measured with the Spectral
Modular Airborne Radiation measurement sysTem (SMART)-Albedometer
developed at the Leibniz Institute for Tropospheric Research (IfT), Leipzig,
Germany. By connecting specific optical inlets to a set of up to six
spectrometers, this instrument allows the measurement of different radiometric
quantities (irradiance, radiance, actinic radiation) on airborne platforms.
During the CONCERT experiment, an optical inlet with a viewing angle of 1.5°
designed to measure radiances as well as an irradiance optical inlet (half-dome
shape) are each connected to two plain-grated spectrometers, respectively. The
optical inlets are placed in the back part of the fuselage of the aircraft (see
foto).
The spectrometers operate in the wavelength ranges 350--1050 nm and 900--2200 nm
with spectral resolutions (Full Width at Half Maximum, FWHM) of 2--3 nm and
9--16 nm, respectively. The temporal resolution of the measurements is in the
order of 0.5--3s, corresponding to a spatial resolution of 100--600m at an
aircraft velocity of 200m/s.


The Fish instrument has been developed at
Forschungszentrum Jülich (Germany) to measure H2O in the upper troposphere and
lower stratosphere. It mainly consists of
- a Lyman-alpha radiation source
- a mirror drive
- a fluorescence cell
- two VUV radiation detectors (NO-cells)
- and a photomultiplier tube (PMT) as optical part.
The instrument is closed and the measuring system is based on the Lyman-alpha
photofragment fluorescence technique:
Radiation with a wavelength of 121,6 lambda is emitted by a lamp which is filled
with a H2/Ar-mixture. To avoid contamination of the fluorescence cell due to the
lamp-gas a MgF2-window is placed in the outlet of the lamp to make it tight. The
Lyman-alpha radiation gets to a mirror-drive, where three different
mirror-positions enable to determine the background, the intensity of the
Lyman-alpha radiation and the dark counts with the VUV detectors and the PMT. In
the fluorescence cell the H2O-molecules of the moist air are now
photodissociated by the high-energetic radiation, thus electronically excited OH
is produced.
H20 + hv ----> OH* + H ; if lambda < 137nm
Since OH relaxes to the ground state, fluorescence radiation is emitted.
OH* ----> OH + hv ; if 280 < lambda < 330nm
Because fluorescence-photons and water-mixing ratio are proportional,
measurements of fluorescence are used to determine humidity of the air.
With a measurement frequency of 1 Hz, the noise equivalent mixing ratio at 3
ppmv is 0.2-0.15 ppmv, and the detection limit is 0.18-0.13 ppmv.
The arrurancy of FISH is 6% * value + 0,2 ppmv.
More details of the instrument and the calibration procedure are described in
Zöger et al. [1999]
Updated 15-Oct-2008.

|
CONCERT 2008 Home ... News ... Internal Login ... ECWMF forecast (internal)