
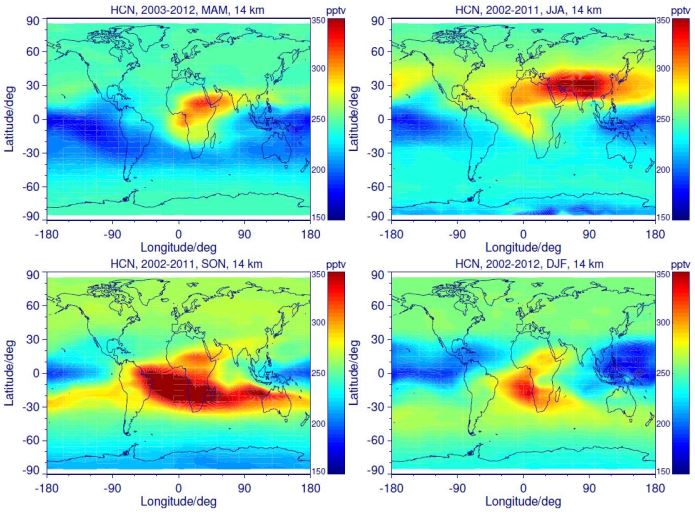
Fig. CHEM2-2: From Fig. 3 in Glatthor et al., 2015a: “Climatological global HCN distributions measured by MIPAS during March to May (top left), June to August (top right), September to November (bottom left) and December to February (bottom right) at 14 km altitude. The distributions are averaged over the time period 2002 to 2012. Here and in subsequent contour plots values exceeding the displayed VMR range are also displayed in dark red.”