
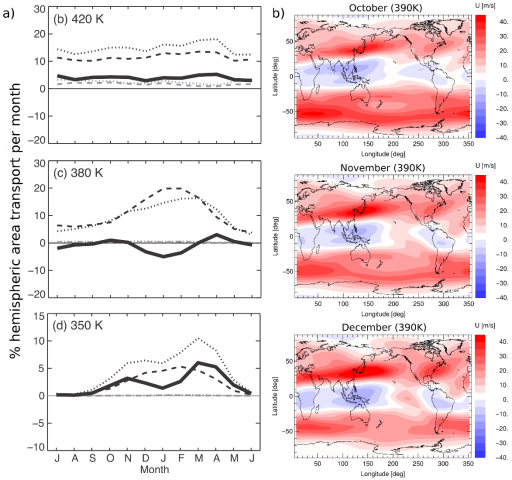
Figure DYN1-3: (a) Annual cycle of Rossby wave-breaking transport at 420K (top), 380K (middle) and 350K (bottom). Anticyclonically sheared events are shown in black and cyclonically sheared events in gray. Dashed lines are equatorward transport and dotted lines poleward. The thick black line is the net transport (stratosphere to troposphere at lower levels). (Figure adapted from Homeyer and Bowman, 2013). (b) Climatological zonal wind U at 390 K from ERA-Interim for October (top), November (middle) and December (bottom).