
This series of Campaign Insights is written during the DLR Patagonia Wave Soaring campaign in El Calafate, Argentina in Sep/Oct 2019. The measurement campaign coincides with and supports the SOUTHTRAC campaign in Rio Grande, Argentina. The intention of this article is to give insights into this measurement campaign from the perspective of a student.
It is written by me, Ramona, aerospace master student at the DLR Institute of Atmospheric Physics (IPA).
Hola a todos! Greetings from the DLR Patagonia Wave Soaring Team from El Calafate!
During our 5-weeks campaign, an instrumented motor glider conducts measurements of the three wind velocity components applying a gust probe developed at our institute. Temperature and humidity sensors complete the measurement system. During various flights in the lee of the Andes, we study mountain waves that are excited by strong westerly flow. To support these measurements and the HALO (Gulfstream G550, DLR research aircraft) operations from Rio Grande, we regularly launch radiosondes from El Calafate. We are now two weeks in Patagonia and we were lucky to catch weather situations with strong mountain waves right at the beginning.
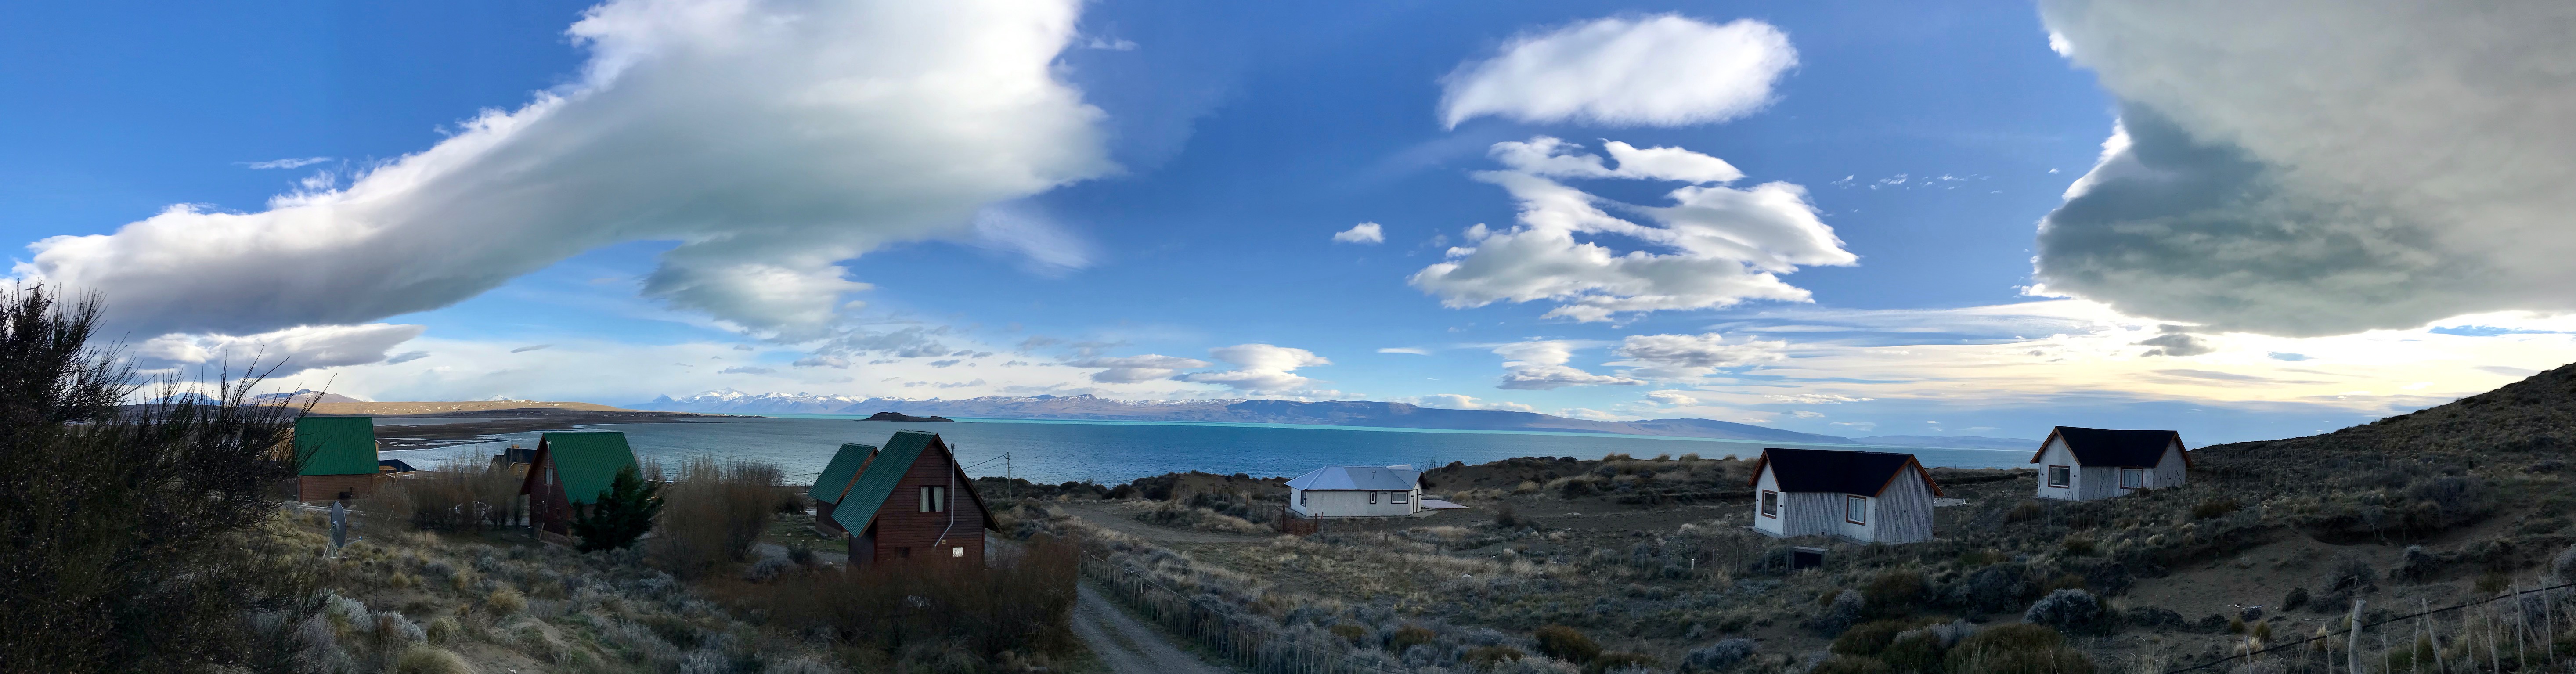
After arrival on 4th September 2019, we picked up our boxes packed with the equipment and radiosondes sent by freight. After checking them for completeness and functionality, we set up the ground weather station in front of our cabañas on the outskirts of El Calafate. The place is nearly perfect for launching radiosondes, only a hill towards the east might be an obstacle for the telemetry when the balloon drifts directly to the east.

The ground weather station of the LMU (Ludwig Maximilian University of Munich) provides us with the input values necessary for the radiosonde ascents, such as humidity, temperature, wind speed and direction. Before the weekend our gas was delivered: a bunch of large bottles of helium is now resting in front of the cabins. We were ready for launch before HALO arrived in Rio Grande.
The following Monday our whole team, consisting of the two glider pilots and the scientists from DLR and LMU met with the people in charge of the airport. After the last details had been discussed, we were able to launch our first radiosonde a few hours later. As we had 30 radiosondes, we only launch radiosondes on measurement days in predefined intervals.
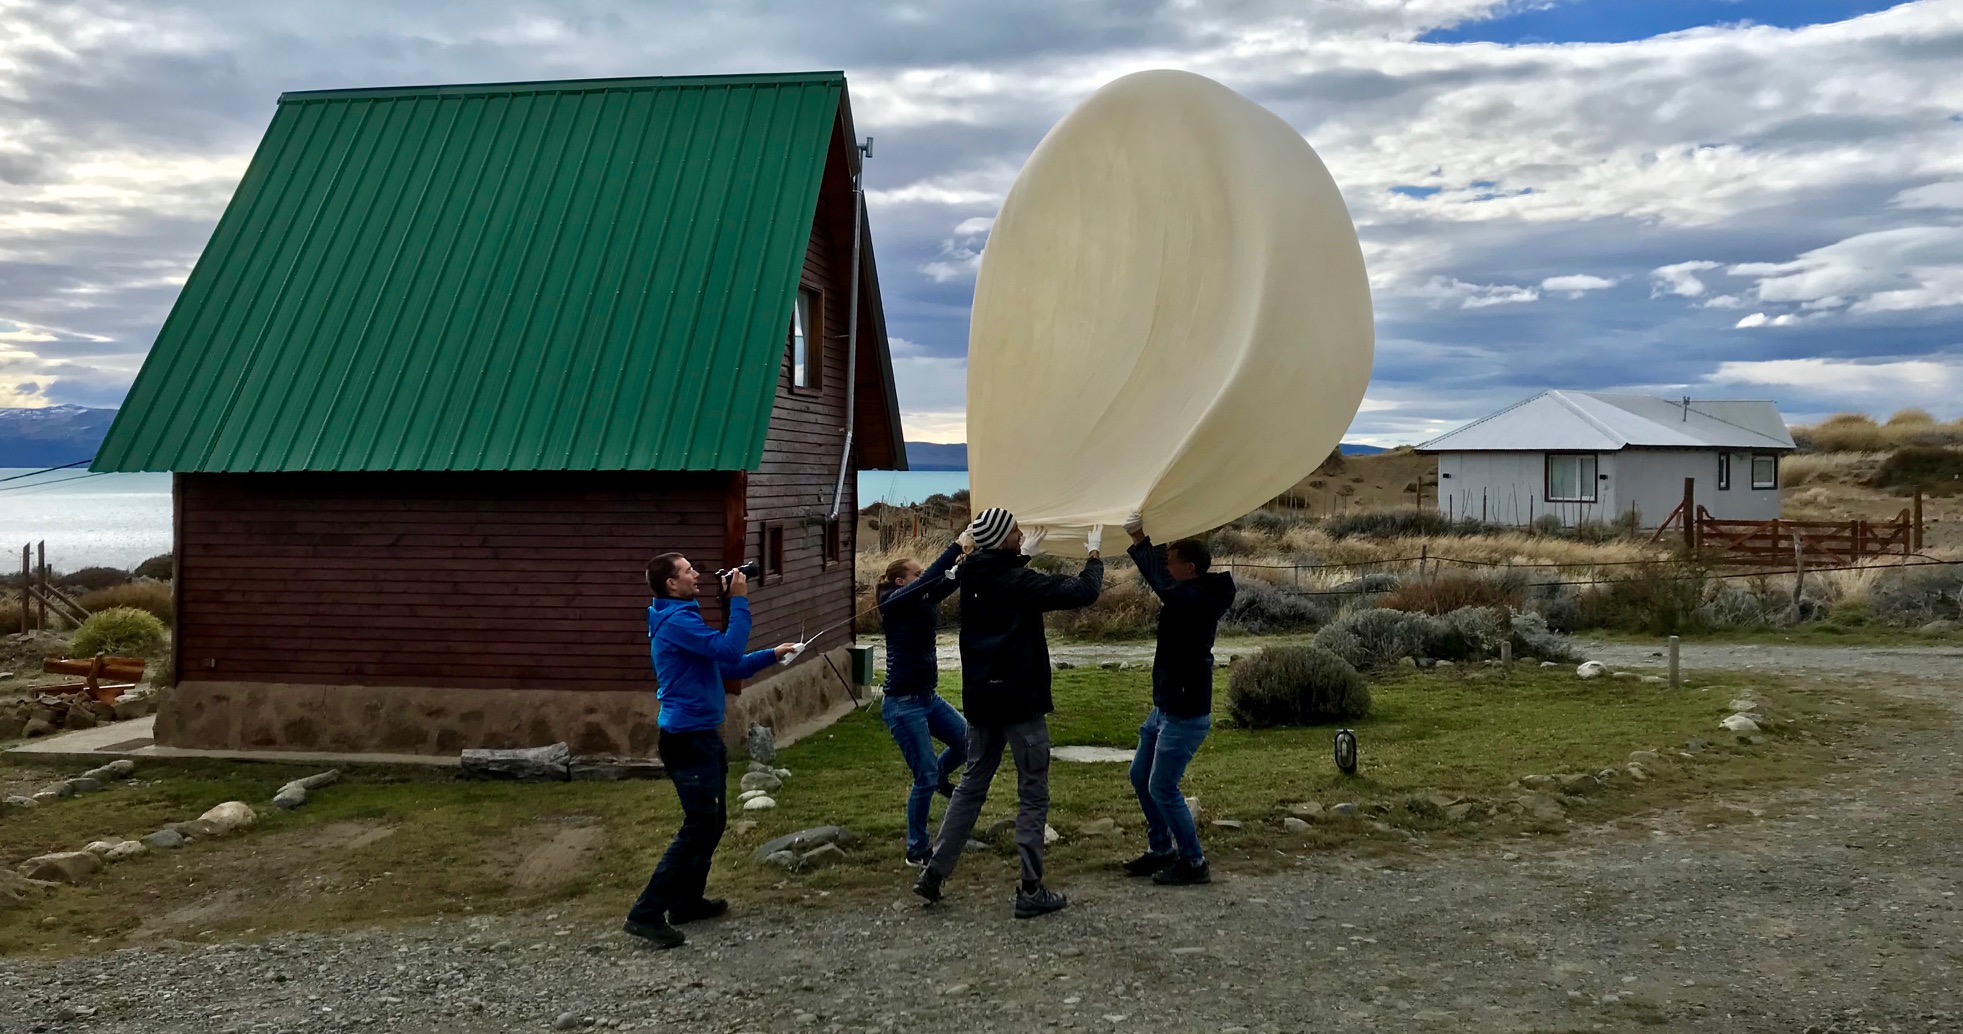
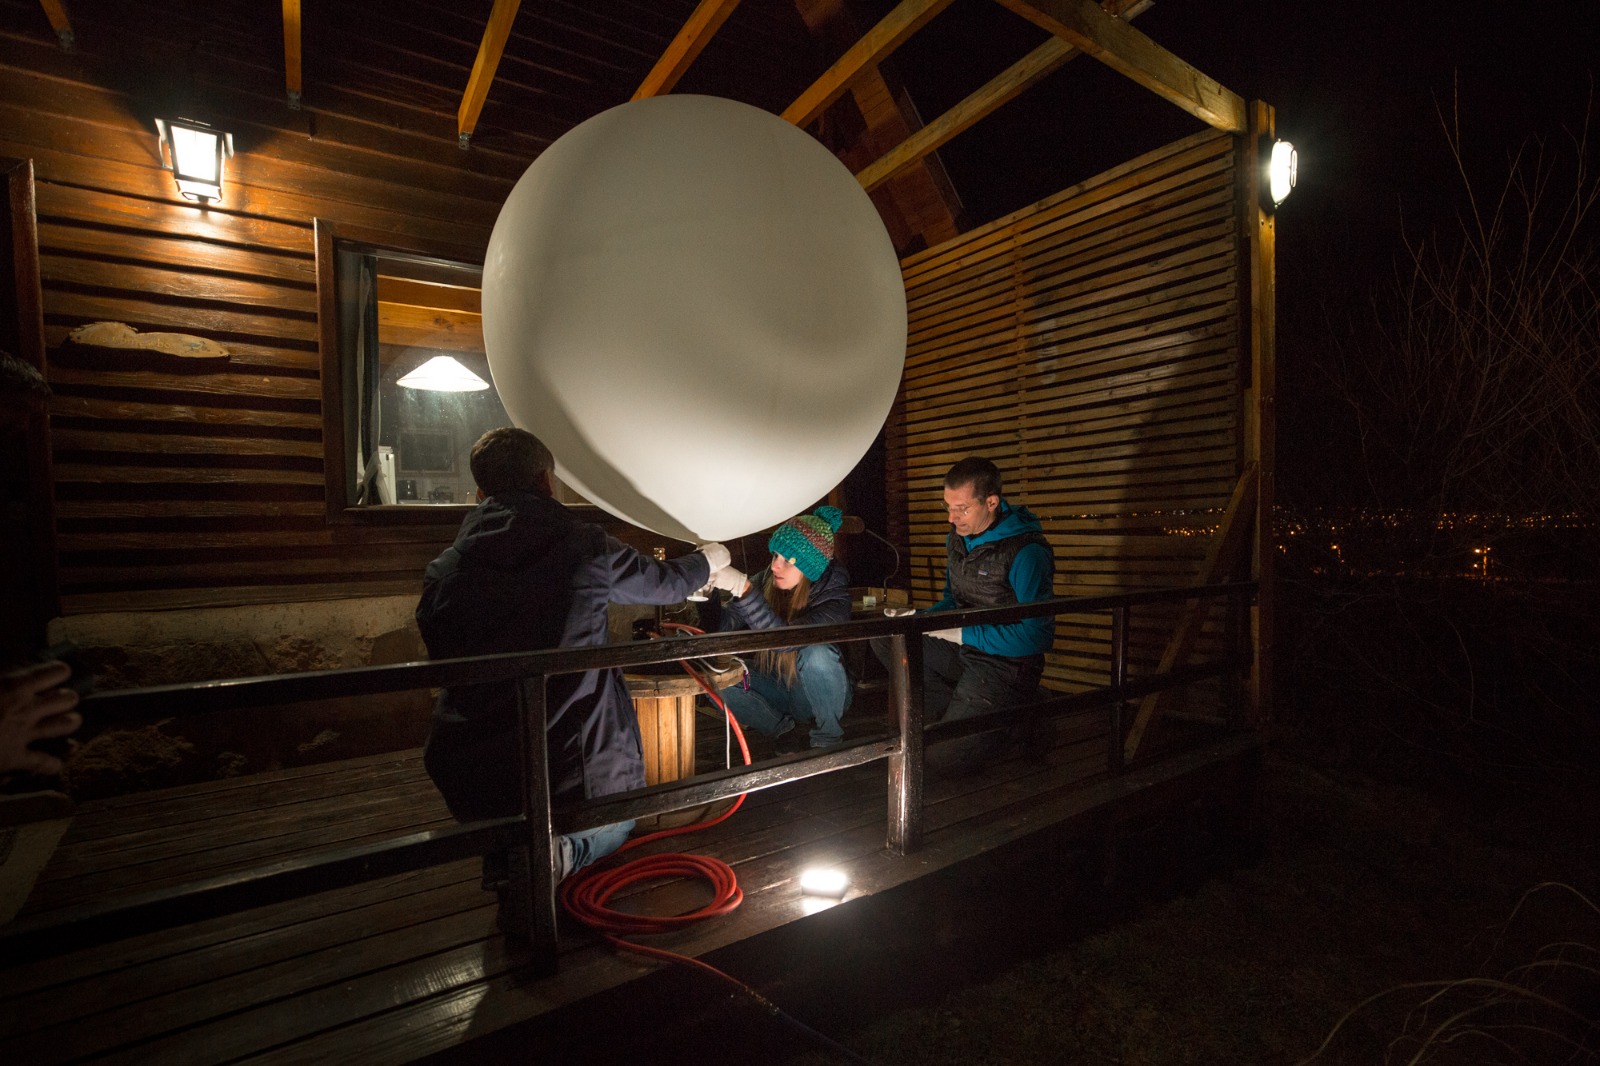
Launching radiosondes consists of a few steps. First, the radiosonde itself needs to be calibrated and activated. Then the balloon, we use small (500 g) and big (3000 g) latex balloons, needs to be filled with helium. A filling station helps us to fix the nozzle of the balloon during the inflating process. Depending on the wind, this can be difficult because the balloon should not get in contact with the ground, branches of the bushes around or other spiky things that could possibly damage the balloon’s skin. For this reason, we use gloves and try to protect it from any sharp objects. Lessons were learnt, as a balloon does not only bend in the direction of the wind, it also stretches itself and the roofs of our houses have sharp edges.
After the balloon is ready, the radiosonde is attached to an unwinder with a 30 m cord. It is needed to ensure that the radiosonde is not affected by the wake turbulence produced by the ascending balloon and, therefore, the temperature sensor shall measure outside the wake. On the other hand, the balloon could damage the radiosonde and vice versa. Because of the strong winds, which are mostly present in Patagonia, the balloon doesn´t go straight up. So, better check for any obstacles in the beginning of the flight path. After release, we rush to the laptop where we can track the position of the balloon and all sensor measurements like temperature, humidity, wind speed, and wind direction. Usually an ascent lasts around 2 – 2.5 h. As the balloon ascends, the pressure decreases and, therefore, the balloon extends until it bursts. Our radiosondes went up to 34,8km (currently little higher than the record in Rio Grande 😉 ) and delivered measurements despite freezing temperatures of -85°C.
The gathered data can be displayed in several diagrams, one of the most common is the Skew-T diagram:
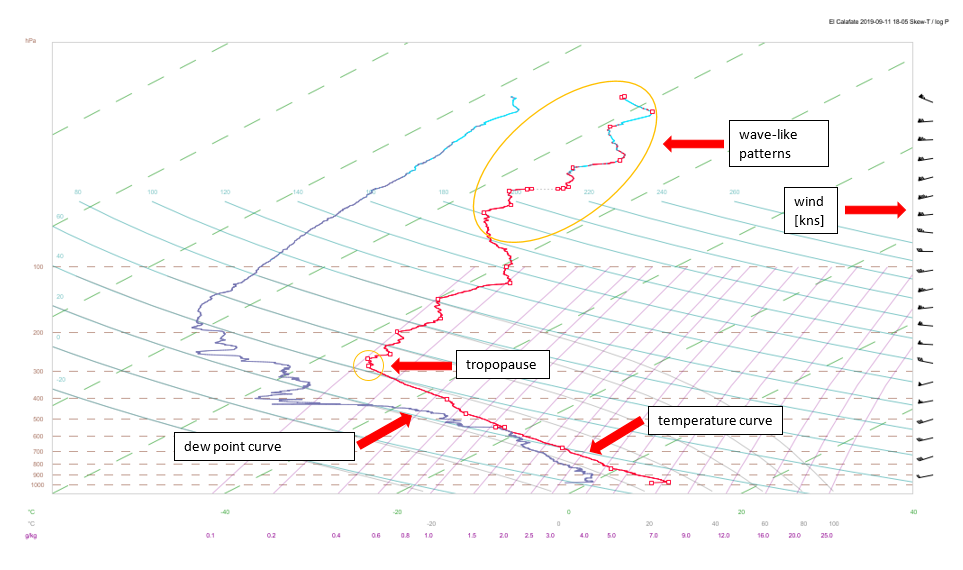
It shows the temperature, the dew point temperature and the wind in dependence of the pressure. The tropopause is clearly visible at around 300 hPa. Above the pronounced tropopause inversion layer lays the stable stratosphere, where wavelike disturbances of the temperature indicate the mountain waves. These vertical profiles are collected, quality controlled and archived. After the campaign, they will be thoroughly analyzed and compared to the data collected with the motor glider and the measurements of HALO. At the end, our measurements contribute to the overall combined dataset that will be available for scientific research after the SOUTHTRAC campaign.
For more photos have a look at:
https://www.pa.op.dlr.de/southtrac/html/soaring/blog.html.
